Matrix Profiles
Lately I’ve been thinking about time series analysis to aid in Reflect’s insights features. Towards this end, I’ve had a Hacker News thread about anomaly detection bookmarked in Later. I finally got to looking at it and there was a comment that mentioned the article left out matrix profiles, which I had never heard of, so I decided to look into them.
Matrix Profiles
Here is an example time series taken from a popular matrix profile library:
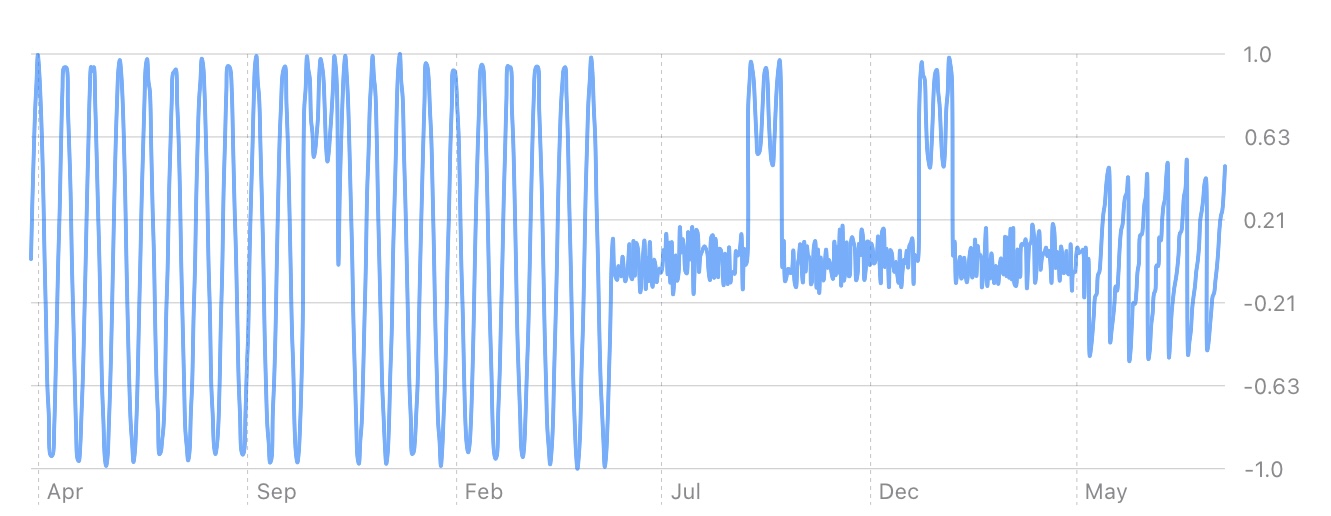
A matrix profile is a vector that describes similarity between windowed subsets of the time series. Each index corresponds to the start of a section and its value’s magnitude corresponds to the uniqueness of that section. The higher the value, the more unique it is. The lower the value, the more common the pattern is.
Here is the matrix profile for the time series shown above, for a 30 day window:
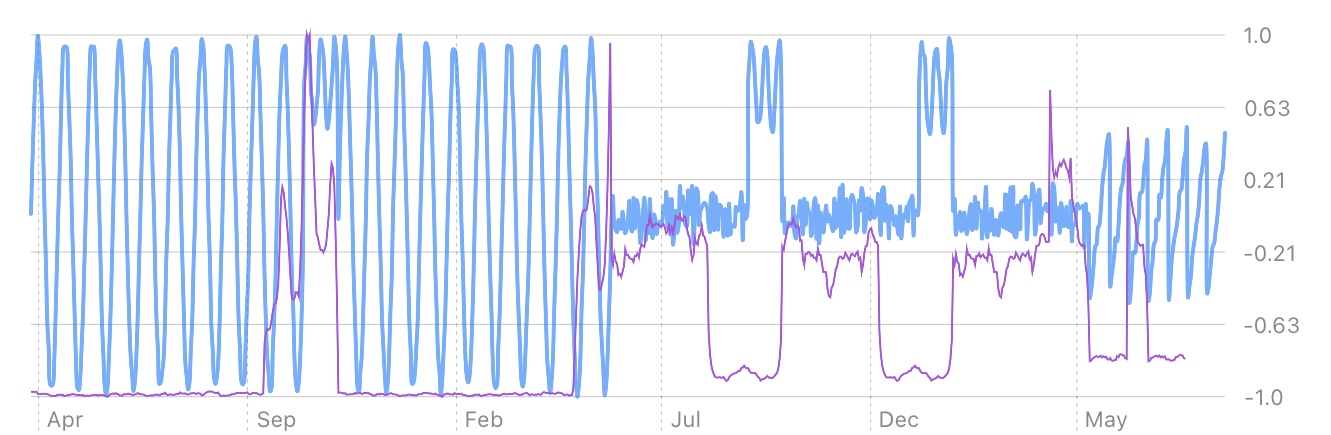
You can see that there are spikes in the matrix profile directly preceding deviations. That’s because each anomaly begins at these points. Anomalies aren’t always so clear, but I thought this time series made for a good illustration. The low points of the matrix profile are called motifs – they are the portions of the time series that are common.
There is an auxiliary vector called the matrix profile index; each element contains a pointer to the index of section that is most similar to the current section. The relationship between a section and its most similar neighbor is not symmetric, meaning that if section A has the highest similarity to section B, it does not imply that section B has the highest similarity to section A. It’s like with Euclidean distance; imagine a scalene triangle with points A, B, and C. A’s closest neighbor is B, but B’s closest neighbor is C.
It turns out that having the matrix profile gets you most of the way towards answering many of the questions one may have when presented with a time series. Anomaly detection is perhaps the most plain to see. The most anomalous sections are the ones with the highest values in the matrix profile, as I mentioned before.
But another application, with a really cool algorithm behind it, is time series segmentation.
Time Series Segmentation with Matrix Profiles
The idea behind time series segmentation is to divide the time series into regions that are self-similar. For example, if you have a group of birds chirping to one another, you may want to identify which portions of the time series correspond to each bird’s song.
Given a matrix profile, we can draw lines above the matrix profile index to visualize the nearest neighbor relationships. Each line creates an arc.
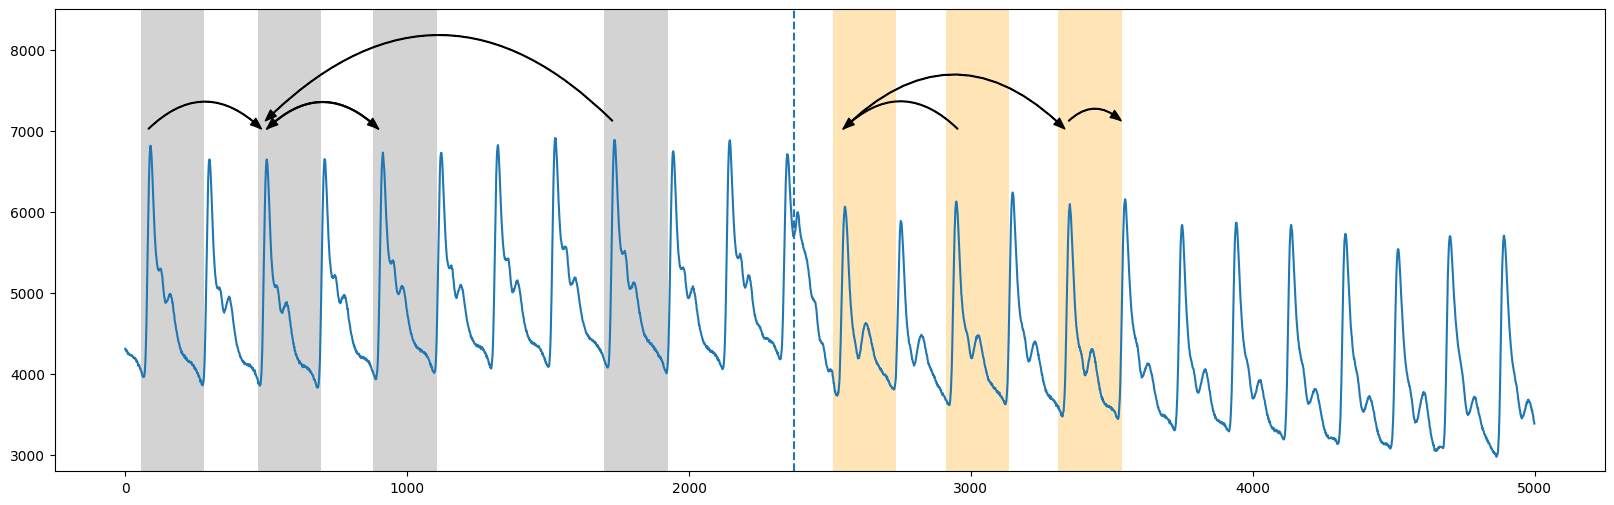
Now, a third vector is constructed by sliding a window and counting the number of arcs that appear above each point. This creates another series, called an arc curve, that describes inflection points where a new segment begins, denoted by local minima on the curve. The algorithm that computes these curves is called FLUSS, and it takes as input the desired number of segments (also called regimes) as well as the matrix profile for the series.
Another cool thing about this algorithm is that it remains robust to common time series artifcats and transformations such as downsampling, smoothing, and linear interpolation.
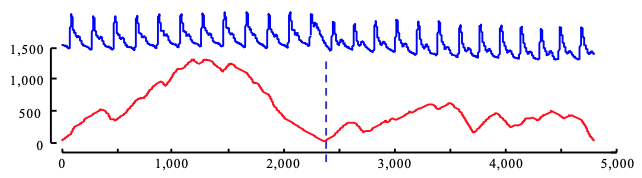
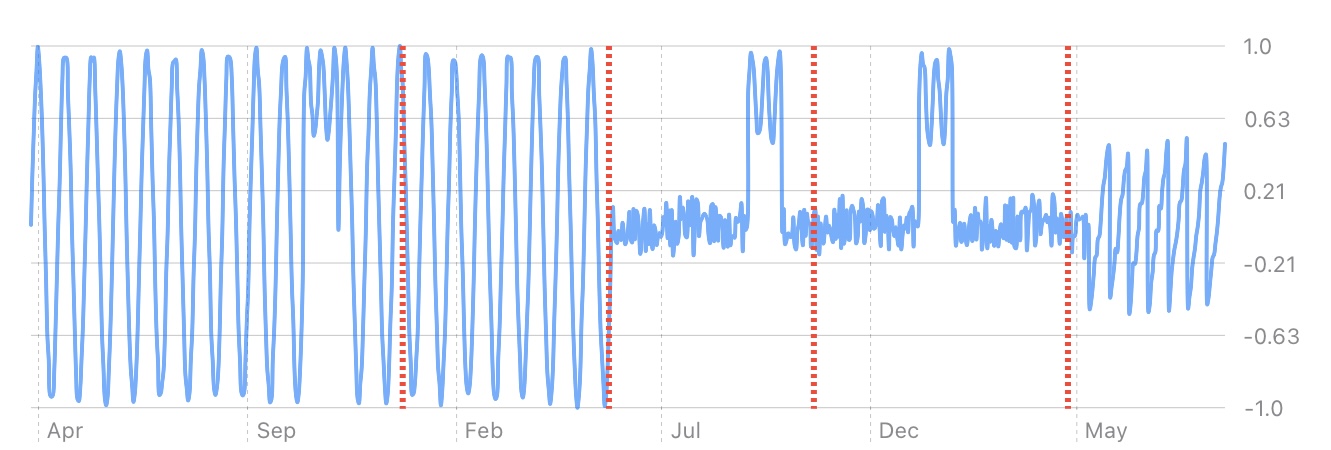
Looking at our original time series, we can see what the segments look like with a window of 30 days and 4 desired segments:
Using the Matrix Profile
I’ve implemented these algorithms in Reflect and will soon be using it to help its users analyze their own personal time series data! As I mentioned before, matrix profiles are a very helpful primitive that sets the stage for further analysis. I’m happy to have casually found this and will be diving into the huge series of papers written about this fascinating idea.